
In order to become an attractive mobility option, public transport in Germany’s largest cities has to be faster
Travel Time Index in the media: Süddeutsche Zeitung, Zeit Online, Berliner Zeitung, WAZ, Berliner Morgenpost, Hamburger Morgenpost
When do people decide
to take public transport
over a car?
Studies show that travel time is a key factor determining which transport mode people choose.
A shift away from the car is only realistic if public transport is able to offer competitive travel times.
To measure this, the mib Travel Time Index systematically compares the travel times of public transport versus cars within a city.
With our internally developed tool, we can visualize and examine the travel times of all routes within a city on a single map.
An index value of 1 indicates that traveling by public transport and by car take the same amount of time. A value of 2 means that it takes twice as long to travel by public transport as it does by car.
The results are clear:
Cars in Germany’s largest cities are 2.06 times faster than public transport.
On many routes, public transport users have a systematic travel time disadvantage.
On average, public transport users need twice as long to reach their destination as people who drive.
Despite frequent traffic jams in German cities, residents on many routes are significantly faster by car than by public transport.
5 levers to make public transport faster.
Within a city, travel time differences between cars and public transport can vary greatly depending on the point of origin and destination.
These 5 levers help make public transport in German cities more competitive in terms of travel time.
-
More rail lines
Public transport is especially fast when its routes are not hindered by road traffic. Cities need more public transport routes with metro, suburban rail, and light rail. Until new rail lines are opened, gaps in the rail network should be filled by attractive bus connections (such as express buses).
-
A “green wave” for light rail and buses on streets
Public transport vehicles are given priority through controlled traffic lights and can drive between stops without interruption. A “green wave” is ensured through dedicated lanes for light rail and bus traps before intersections.
-
Fewer detours and fewer transfers
With public transport, long detours and multiple transfers are sometimes necessary to reach a destination. By modifying routes and closing gaps in the network, we can significantly shorten public transport routes – and thus save time.
-
Shorter waiting times
Trips by public transport can also take longer because passengers spend a considerable amount of time waiting. Waiting times can be significantly reduced through higher frequency, better coordinated schedules, and better punctuality.
-
Shorter distances
Significant travel time reductions can be achieved through a denser bus network, new bus stops, additional access points at stations and platforms, and shorter routes when transferring. In areas with low demand, the integration of on-demand minibus services into the public transport tariff structure is also a good approach.
The travel time disadvantage exists in all the cities
we studied.
A direct comparison of Germany’s 11 largest cities shows that they vary only slightly in terms of travel time differences.
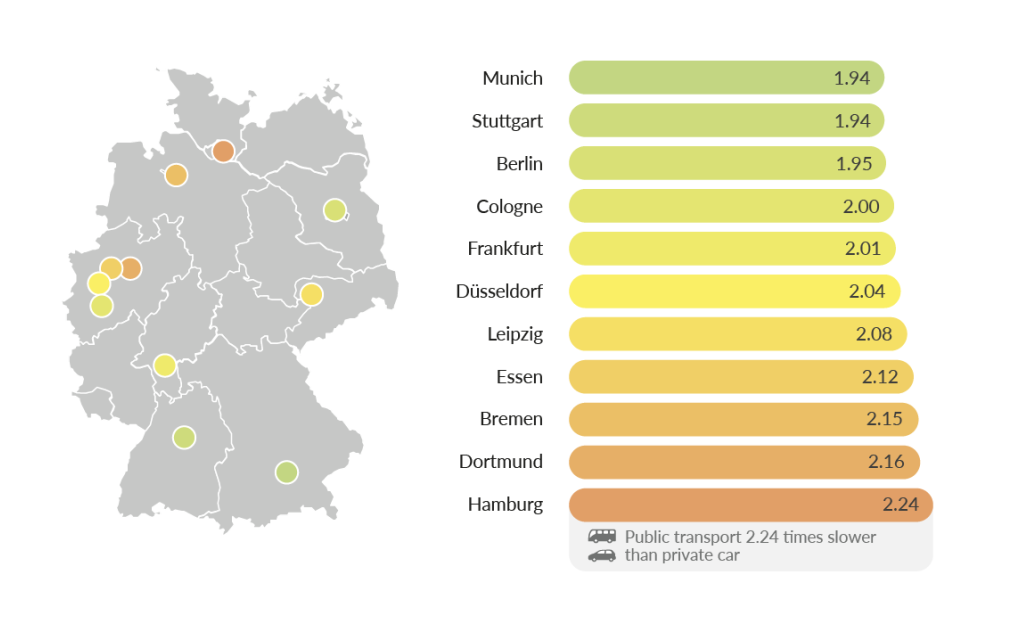
In the following cities, the Travel Time Index shows us where public transport can be improved.
-
![]() Berlin
Berlin
In Berlin, public transport
is on average 1.95 times slower
than the car.
600m of a rail-based public transport station.
-
![]() Hamburg
Hamburg
In Hamburg, public transport
is on average 2.24 times slower
than the car.
40% of the population lives within
600m of a rail-based public transport station.
Travel time comparison for different locations within the cities
Fastest route for public transport vs. car at 8am on a weekday

Alexanderplatz, Berlin
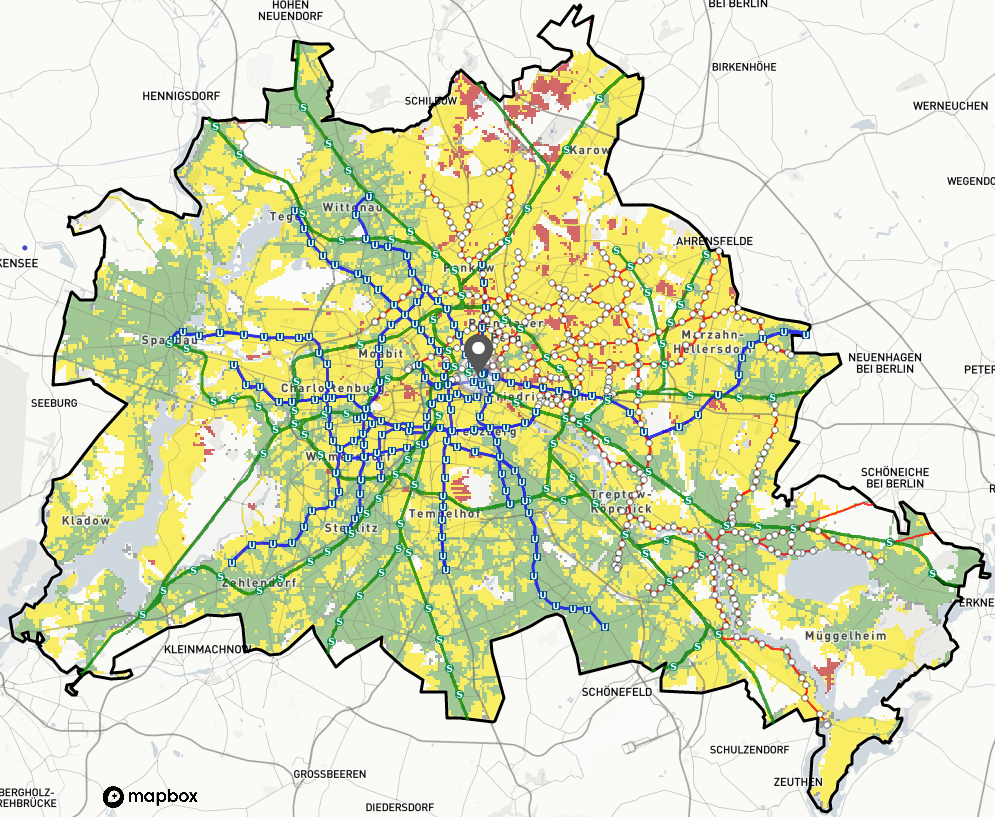
From Alexanderplatz in Berlin, public transport is competitive especially along S- and U-Bahn corridors (travel time index ≤ 1.5). One reaches the northeast of the city much more slowly by public transport than by car. Here there is a lack of direct S- and U-Bahn lines to provide a fast connection, and the existing tram runs at lower average speeds.
Steglitz, Berlin
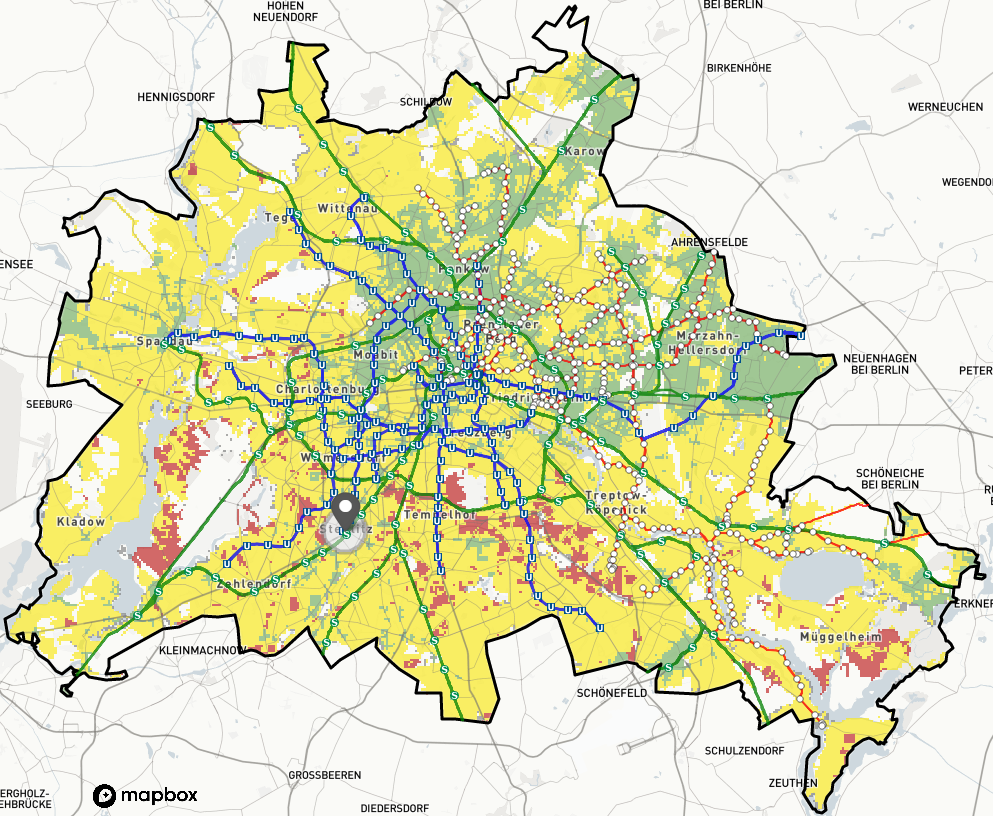
From Berlin Steglitz there are relatively fewer destinations where public transport can compete with the car in terms of travel time. Due to its direct connection to the highway network, many parts of the city can be reached much faster by car. Only in the northeast does the map look different, as there is no freeway here – but there is an S-Bahn connection.
Campus Berlin-Buch
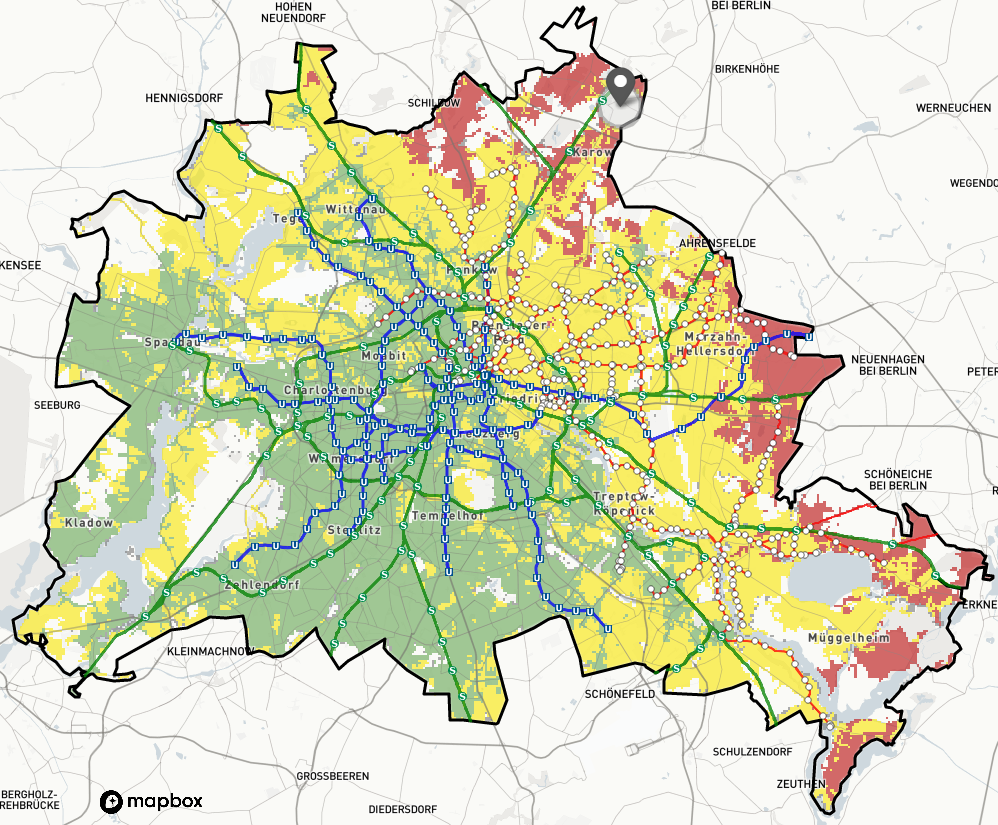
Due to a lack of direct highway connection, public transport from the Buch campus is relatively attractive on the long routes to the southwest, even in areas farther from rail lines. The closer areas in the northwest and southeast are much faster by car, as there are no tangential public transport connections here.
Jungfernstieg, Hamburg
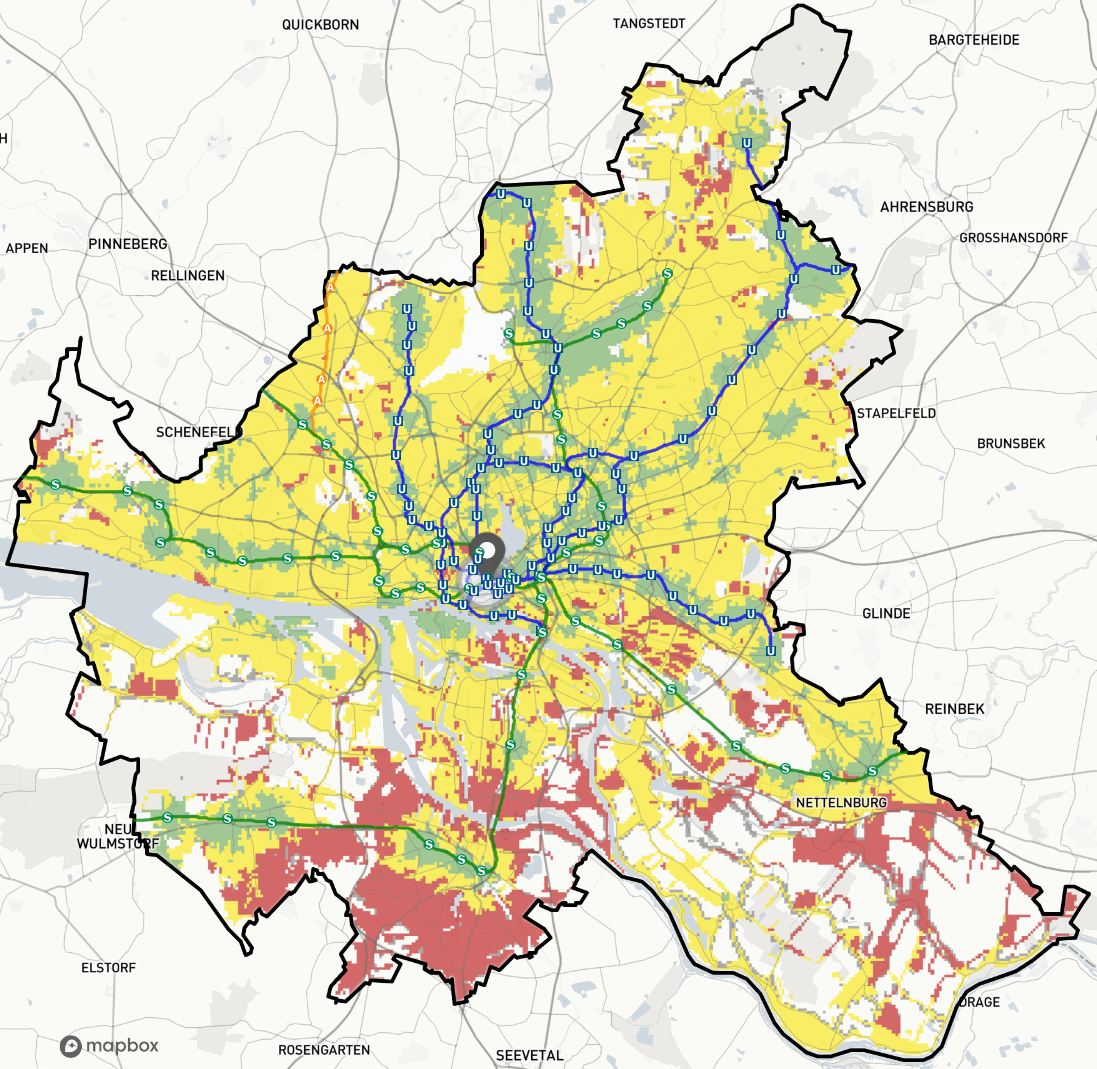
From the center of Hamburg, public transport in almost all directions can only keep up with the car directly along the rail lines. Destinations without connections to the S-Bahn and U-Bahn can be reached much faster by car. To reach the less densely populated areas south of the city, public transport is particularly slow due to the poor coverage of the bus network there. Here, people must walk longer distances to bus stops.
Hamburg Airport
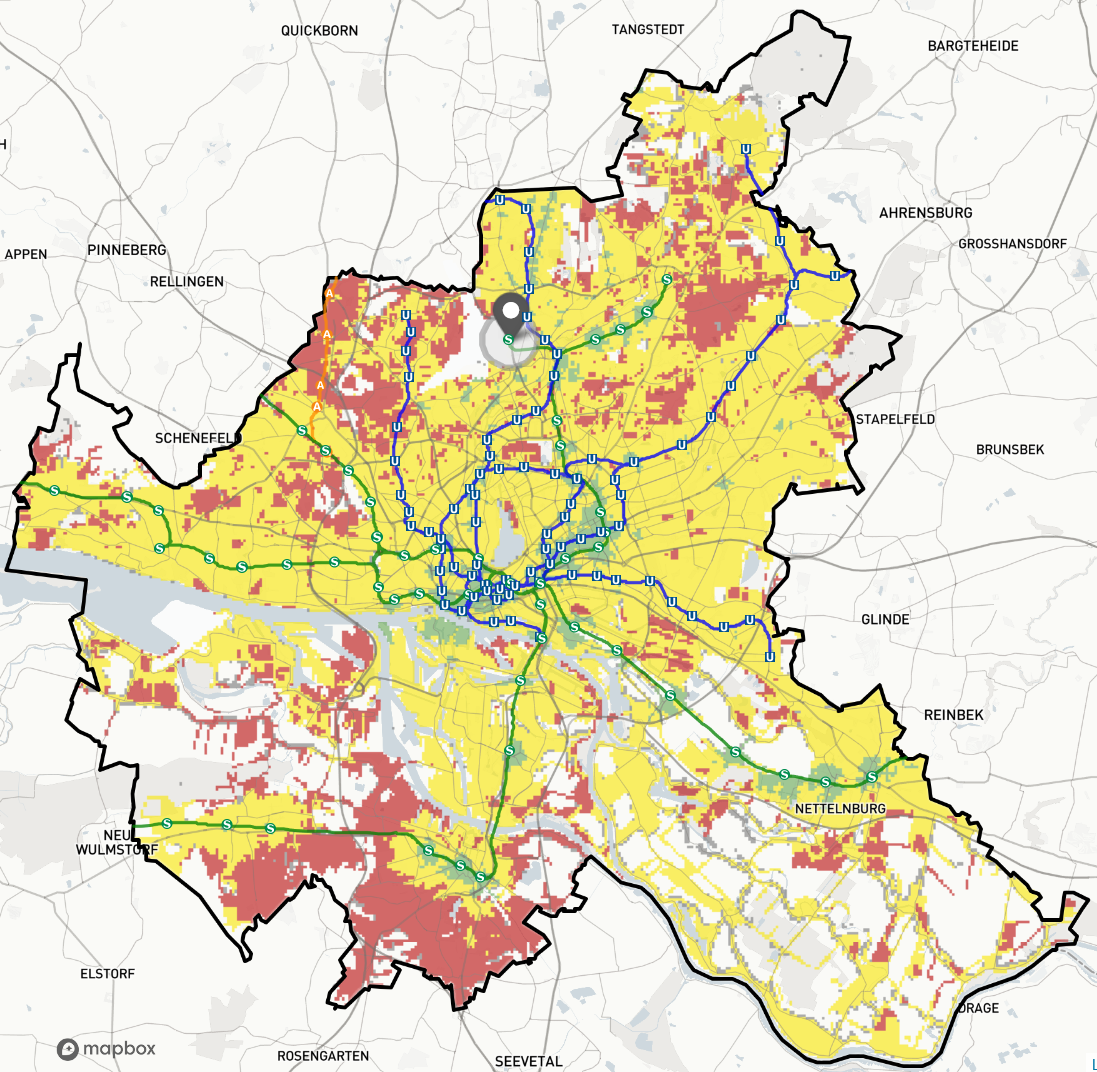
With few exceptions, the Hamburg Airport can be reached from the rest of the city much faster by car than by public transport. While the express lane network is well developed, public transport lacks fast direct connections.
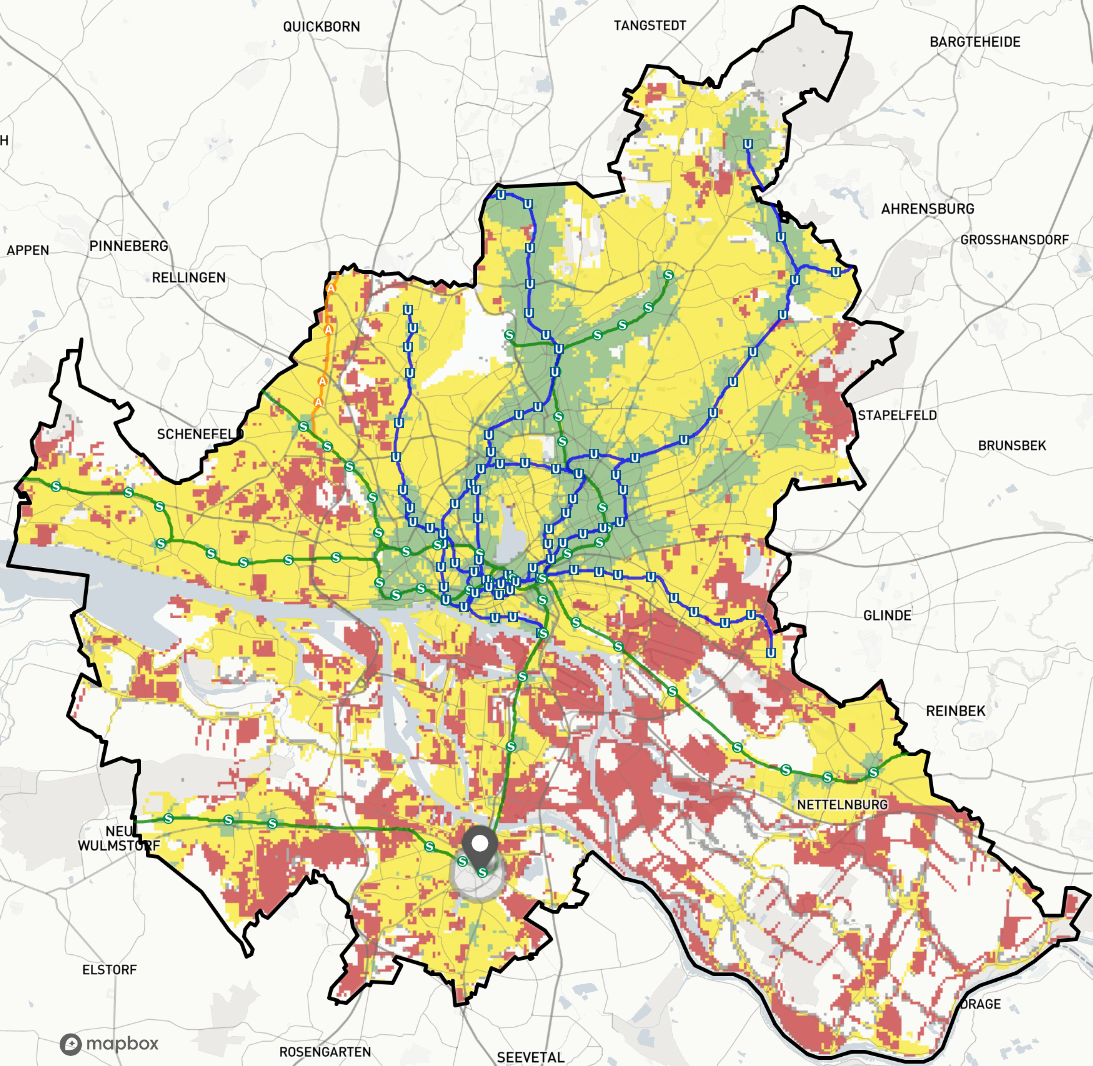
Harburg, Hamburg
About the Travel Time Index
About the Travel Time Index
The Travel Time Index (TTI) of a city is the ratio of the average travel time of public transport and private motorized transport (car), for all possible connections in a city. Through visualization on a city map, it can be determined for which trips public transport is competitive with cars in terms of travel time and in which areas it has a systematic travel time disadvantage. In this way, statements on the competitiveness of public transport can be made for all areas within the city.
The TTI is based on the finding that travel time is the one of the most significant factors influencing the choice of which transport mode to take [1]. Because not all factors that play a role in this decision have available data or are easily integrated within the scope of the study, certain simplifying assumptions were made (see: How is the TTI calculated?). Therefore, the comparison looks at travel time alone and not at other possible factors such as cost and comfort. Furthermore, other means of transportation, such as the bicycle, were not analyzed.
[1] Vgl. Ganji et al. Research Journal of Applied Sciences, Engineering and Technology 6(9): 1680-1684, 2013.
The Travel Time Index is based on a systematic comparison of the travel times of public transport and car. Every possible connection within a city area at a given point in time is considered. Thus, for the calculation, each city is divided into a 100 x 100 m grid and an index value is calculated for each grid cell. This value indicates how quickly all other relevant cells in the city can be reached from this cell by public transport compared to by car.
Calculating the travel time of public transport
The travel time of public transport is calculated using the R package gtfsrouter using each city’s open-source timetable data in GTFS format.
The calculation also includes walking times to public transport stops. For each stop, the areas within 5, 10, 15, 20, 25, and 30 minutes walking distance are determined and added to the public transport travel time.
If a grid cell is not accessible within a 30-minute walk from a stop, a flat travel time index of 3.8 is assigned. This corresponds to quality level F according to VDV guidelines. Areas that cannot be reached from a public transport stop within a 30-minute walk and are not covered by this methodology therefore contribute to the index at this maximum value of 3.8 instead of being completely ignored.
Calculating the travel time of cars
Car travel times were determined using an algorithm from Here Technologies that uses actual travel times from the past. To avoid distortions due to lower traffic volumes during the covid-19 pandemic, car travel times were retrieved for a weekday in January 2020 at 8am. In addition, a 5-minute walk to the parked car is added to each car travel time.
Weighting
To represent mobility behavior as realistically as possible, grid cells are additionally weighted. This weighting approximates the relevance of the grid cells as well as the distance between start and destination cell. Only cells that are within a 30-minute walk of a public transit stop are considered as start grid cells. Thus, areas such as larger parks or forests are not considered.
- Demand: Grid cells within a city have varying relevance as destinations. Areas with greater demand are therefore given more weight in the calculation. The destination grid cells are weighted based on population figures and points of interests (POIs), i.e. places with relevant amenities. Cells with high population density, and therefore greater demand, factor more heavily into the index than those with low population density. Grid cells that are not populated and that contain no POIs are thus not included in the index.
- Distance: Similarly, the distance between two cells is factored into the calculation so that routes to farther cells have a smaller impact on the index value than closer cells.
Calculating the overall index value
The travel time is multiplied by the respective weights so that an index value is now available for each starting grid cell. To then determine an overall value for the city, the values of the starting grid cells are weighted by demand again and averaged.
The Travel Time Index offers decision makers in public transport, such as cities and transport operators, a systematic view of existing service from a user’s perspective. By displaying the travel time index across the entire city, it is possible to identify where the presence of public transport needs to be strengthened to be competitive on important routes.
The travel time ratio between public transport and car is determined by the respective points of origin and destinations within a city. Thus, the comparison helps identify for which routes public transport has a travel time disadvantage and how large that disadvantage is. Any improvement measures can therefore be strategically targeted. The Travel Time Index also shows where public transport can be accelerated by closing gaps and expanding services on routes with high demand.
The Travel Time Index is based on an application internally developed by mib. Brant Konetchy, Hans Schrader and Ildiko Szabo were significantly involved in the development.
Other developers involved were Tom Jaksztat and Alexandra Kapp.
Data Tools and Sources
Data and programming interfaces from HERE Technologies, such as the HERE Geocoding and Search API and the HERE Isoline API, serve as the basis for the calculations of POI intensity, walking time and car travel times.
Travel times for public transport were estimated using the gtfsrouter R package. For this purpose, open-source timetable data available in GTFS format were used.
The schedules are based on GTFS feeds from the respective transport authorities or DELFI e.V. The analysis is based on a query from January 12, 2021.
Provider of GTFS:
DELFI e.V
Link zum Downloadbereich GTFS-Feed
Lizenz: CC BY
Hamburger Verkehrsverbund GmbH
Link zum Downloadbereich GTFS-Feed
Lizenz: dl-de/by-2-0
Verkehrs- und Tarifverbund Stuttgart GmbH
Link zum Downloadbereich GTFS-Feed
Lizenz: CC BY
Verkehrsverbund Rhein-Sieg GmbH
Link zum Downloadbereich GTFS-Feed
Lizenz: CC BY 4.0
Verkehrsverbund Berlin-Brandenburg GmbH
Link zum Downloadbereich GTFS-Feed
Lizenz: CC BY 4.0
Mitteldeutscher Verkehrsverbund GmbH
Link zum Downloadbereich GTFS-Feed
Lizenz: CC BY 4.0
Maps and the street network for the routing come from OpenStreetMap.
© OpenStreetMap-Mitwirkende
The data on population density come from the 2011 census of the federal and state statistical offices.
