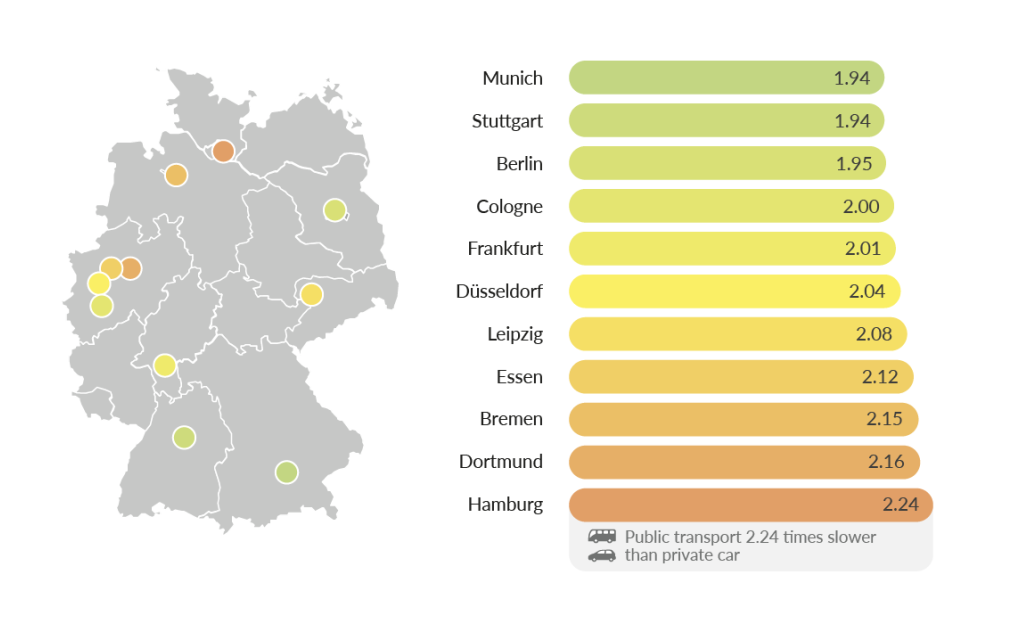
In order to become an attractive mobility option, public transport in Germany’s largest cities has to be faster

The results are clear:
Cars in Germany’s largest cities are 2.06 times faster than public transport.

-
More rail lines
Public transport is especially fast when its routes are not hindered by road traffic. Cities need more public transport routes with metro, suburban rail, and light rail. Until new rail lines are opened, gaps in the rail network should be filled by attractive bus connections (such as express buses).
-
A “green wave” for light rail and buses on streets
Public transport vehicles are given priority through controlled traffic lights and can drive between stops without interruption. A “green wave” is ensured through dedicated lanes for light rail and bus traps before intersections.
-
Fewer detours and fewer transfers
With public transport, long detours and multiple transfers are sometimes necessary to reach a destination. By modifying routes and closing gaps in the network, we can significantly shorten public transport routes – and thus save time.
-
Shorter waiting times
Trips by public transport can also take longer because passengers spend a considerable amount of time waiting. Waiting times can be significantly reduced through higher frequency, better coordinated schedules, and better punctuality.
-
Shorter distances
Significant travel time reductions can be achieved through a denser bus network, new bus stops, additional access points at stations and platforms, and shorter routes when transferring. In areas with low demand, the integration of on-demand minibus services into the public transport tariff structure is also a good approach.
-
![]() Berlin
Berlin

In Berlin, public transport
is on average 1.95 times slower
than the car.
600m of a rail-based public transport station.
-
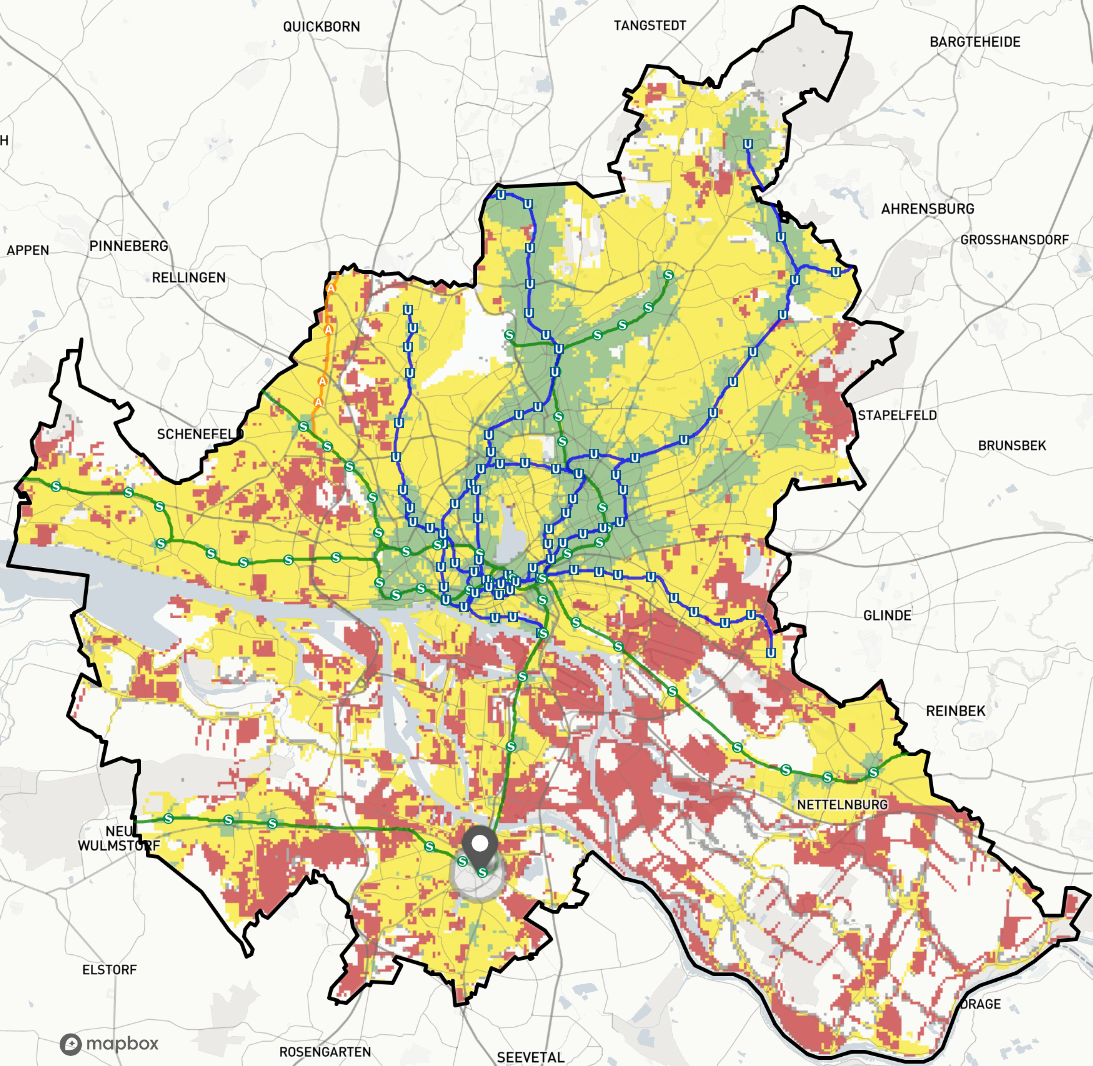
![]() Hamburg
Hamburg
In Hamburg, public transport
is on average 2.24 times slower
than the car.
40% of the population lives within
600m of a rail-based public transport station.
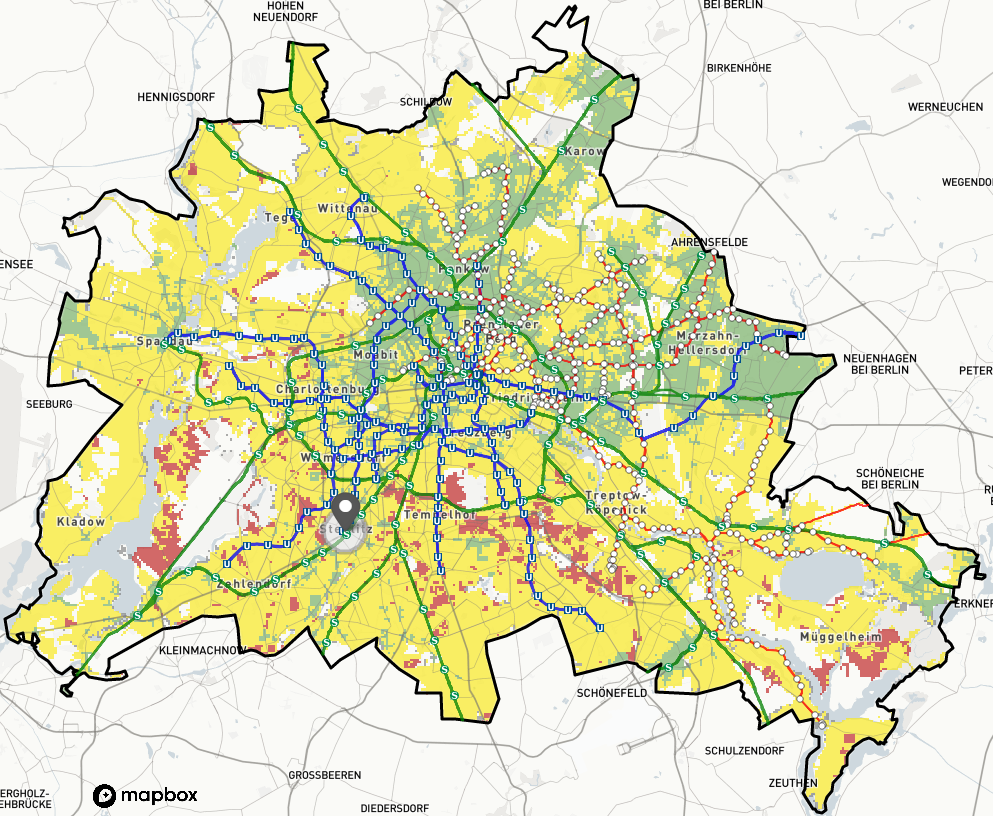
Travel time comparison for different locations within the cities
Fastest route for public transport vs. car at 8am on a weekday

Alexanderplatz, Berlin
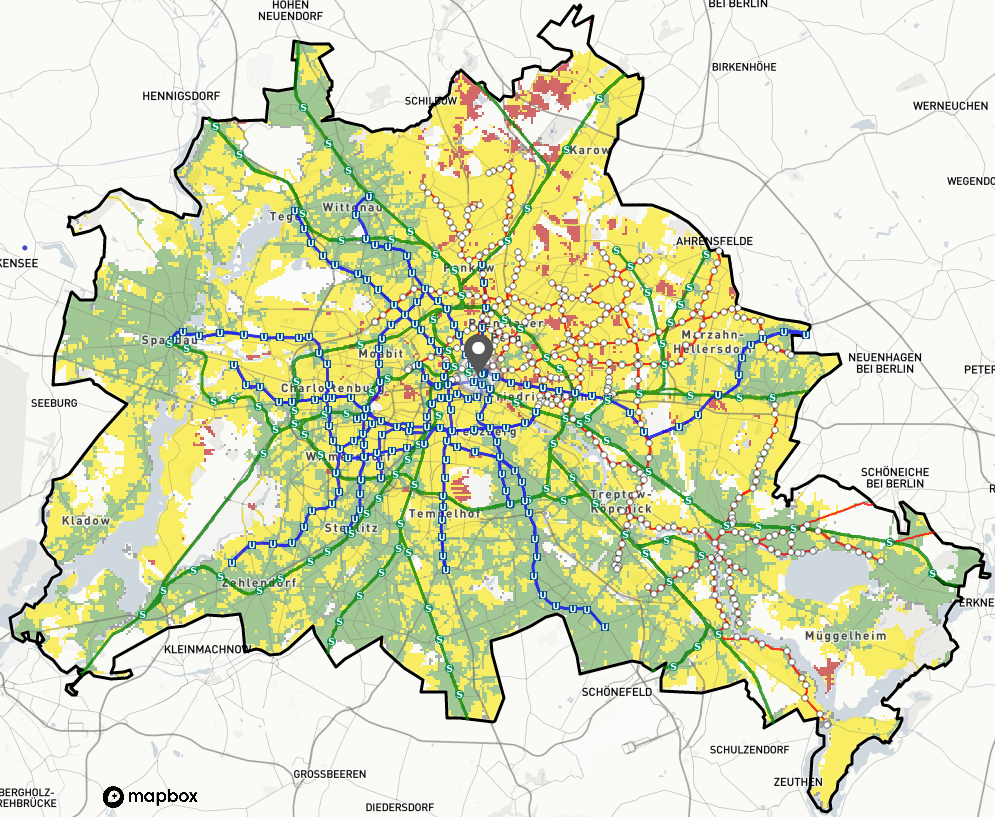
From Alexanderplatz in Berlin, public transport is competitive especially along S- and U-Bahn corridors (travel time index ≤ 1.5). One reaches the northeast of the city much more slowly by public transport than by car. Here there is a lack of direct S- and U-Bahn lines to provide a fast connection, and the existing tram runs at lower average speeds.
Steglitz, Berlin
From Berlin Steglitz there are relatively fewer destinations where public transport can compete with the car in terms of travel time. Due to its direct connection to the highway network, many parts of the city can be reached much faster by car. Only in the northeast does the map look different, as there is no freeway here – but there is an S-Bahn connection.
Campus Berlin-Buch
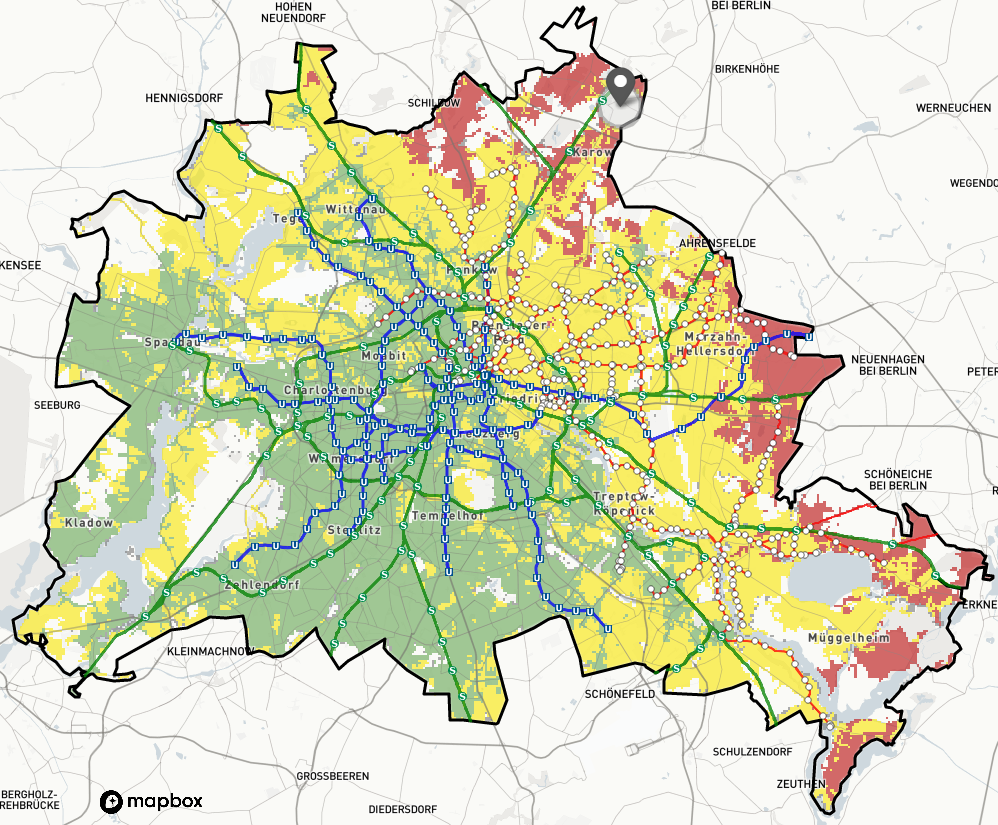
Due to a lack of direct highway connection, public transport from the Buch campus is relatively attractive on the long routes to the southwest, even in areas farther from rail lines. The closer areas in the northwest and southeast are much faster by car, as there are no tangential public transport connections here.
Jungfernstieg, Hamburg
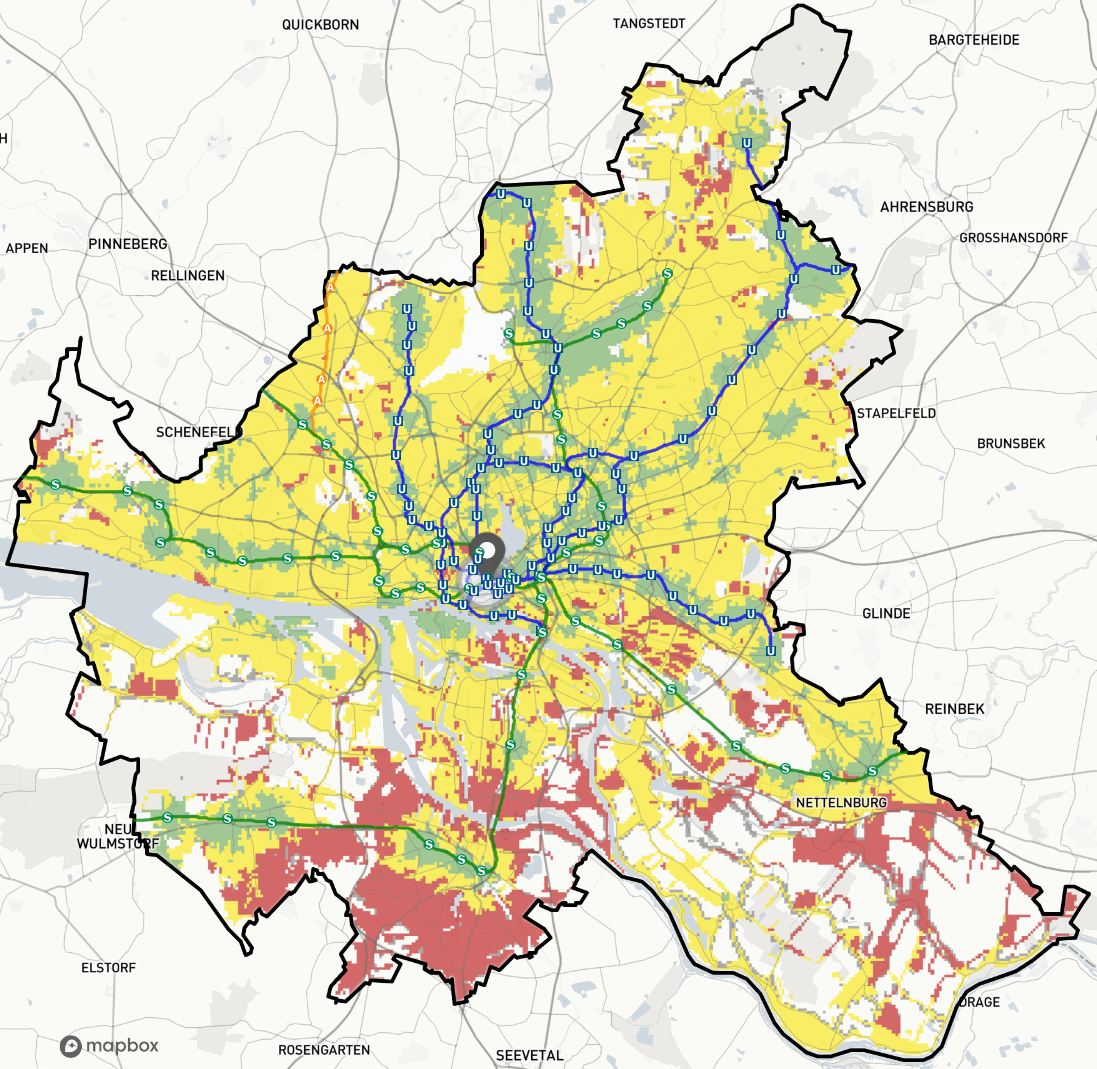
From the center of Hamburg, public transport in almost all directions can only keep up with the car directly along the rail lines. Destinations without connections to the S-Bahn and U-Bahn can be reached much faster by car. To reach the less densely populated areas south of the city, public transport is particularly slow due to the poor coverage of the bus network there. Here, people must walk longer distances to bus stops.
Hamburg Airport
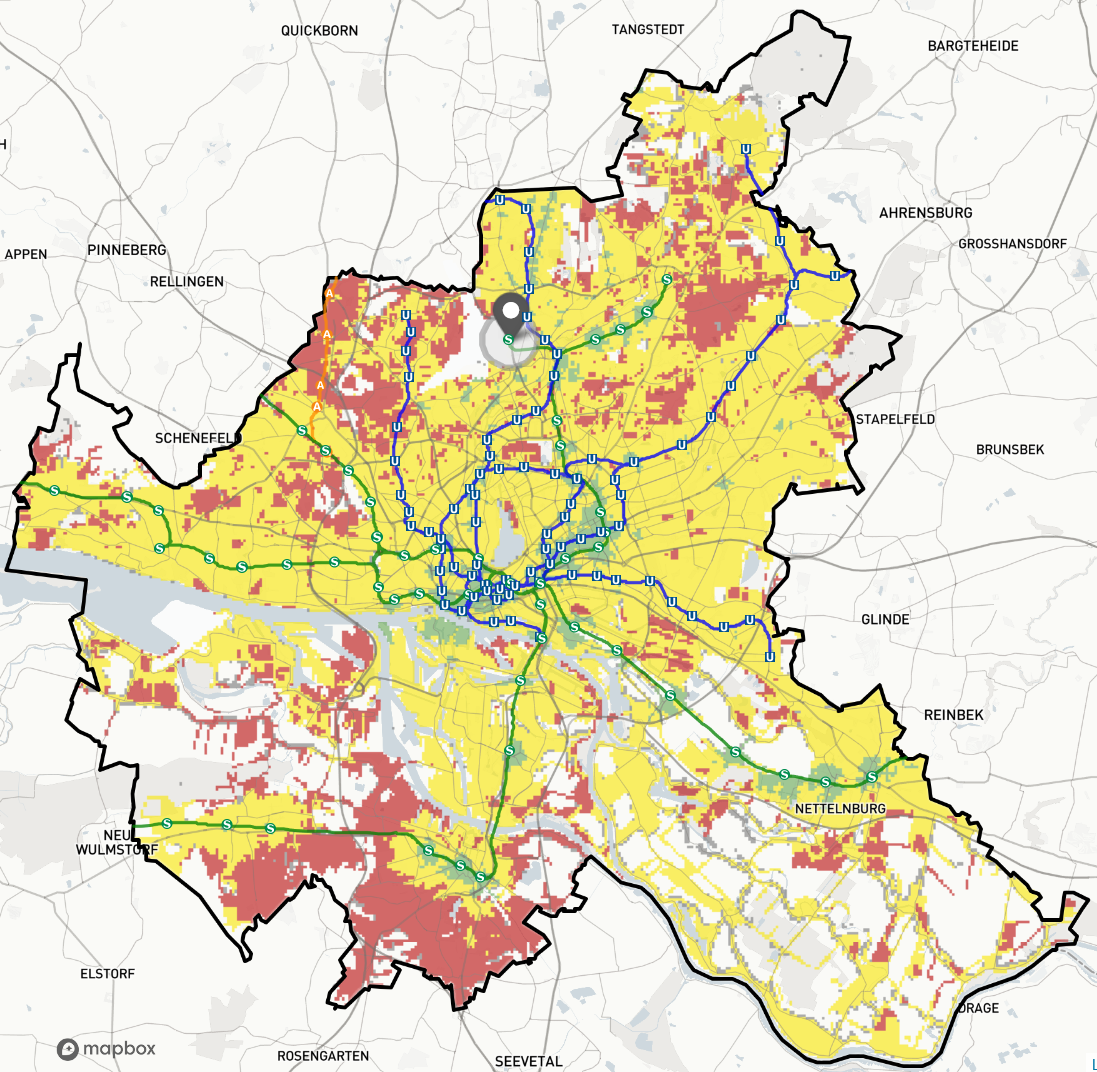
With few exceptions, the Hamburg Airport can be reached from the rest of the city much faster by car than by public transport. While the express lane network is well developed, public transport lacks fast direct connections.
Harburg, Hamburg